Feature #19571
closed")
Add REMEMBERED_WB_UNPROTECTED_OBJECTS_LIMIT_RATIO to the GC
Description
GitHub PR: https://github.com/ruby/ruby/pull/7577
The proposed PR adds the environment variable RUBY_GC_HEAP_REMEMBERED_WB_UNPROTECTED_OBJECTS_LIMIT_RATIO which is used to calculate the remembered_wb_unprotected_objects_limit using a ratio of old_objects. This should improve performance by reducing major GC because, in a major GC, we mark all of the old objects, so we should have more uncollectible WB unprotected objects before starting a major GC. The default has been set to 0.01 (1% of old objects).
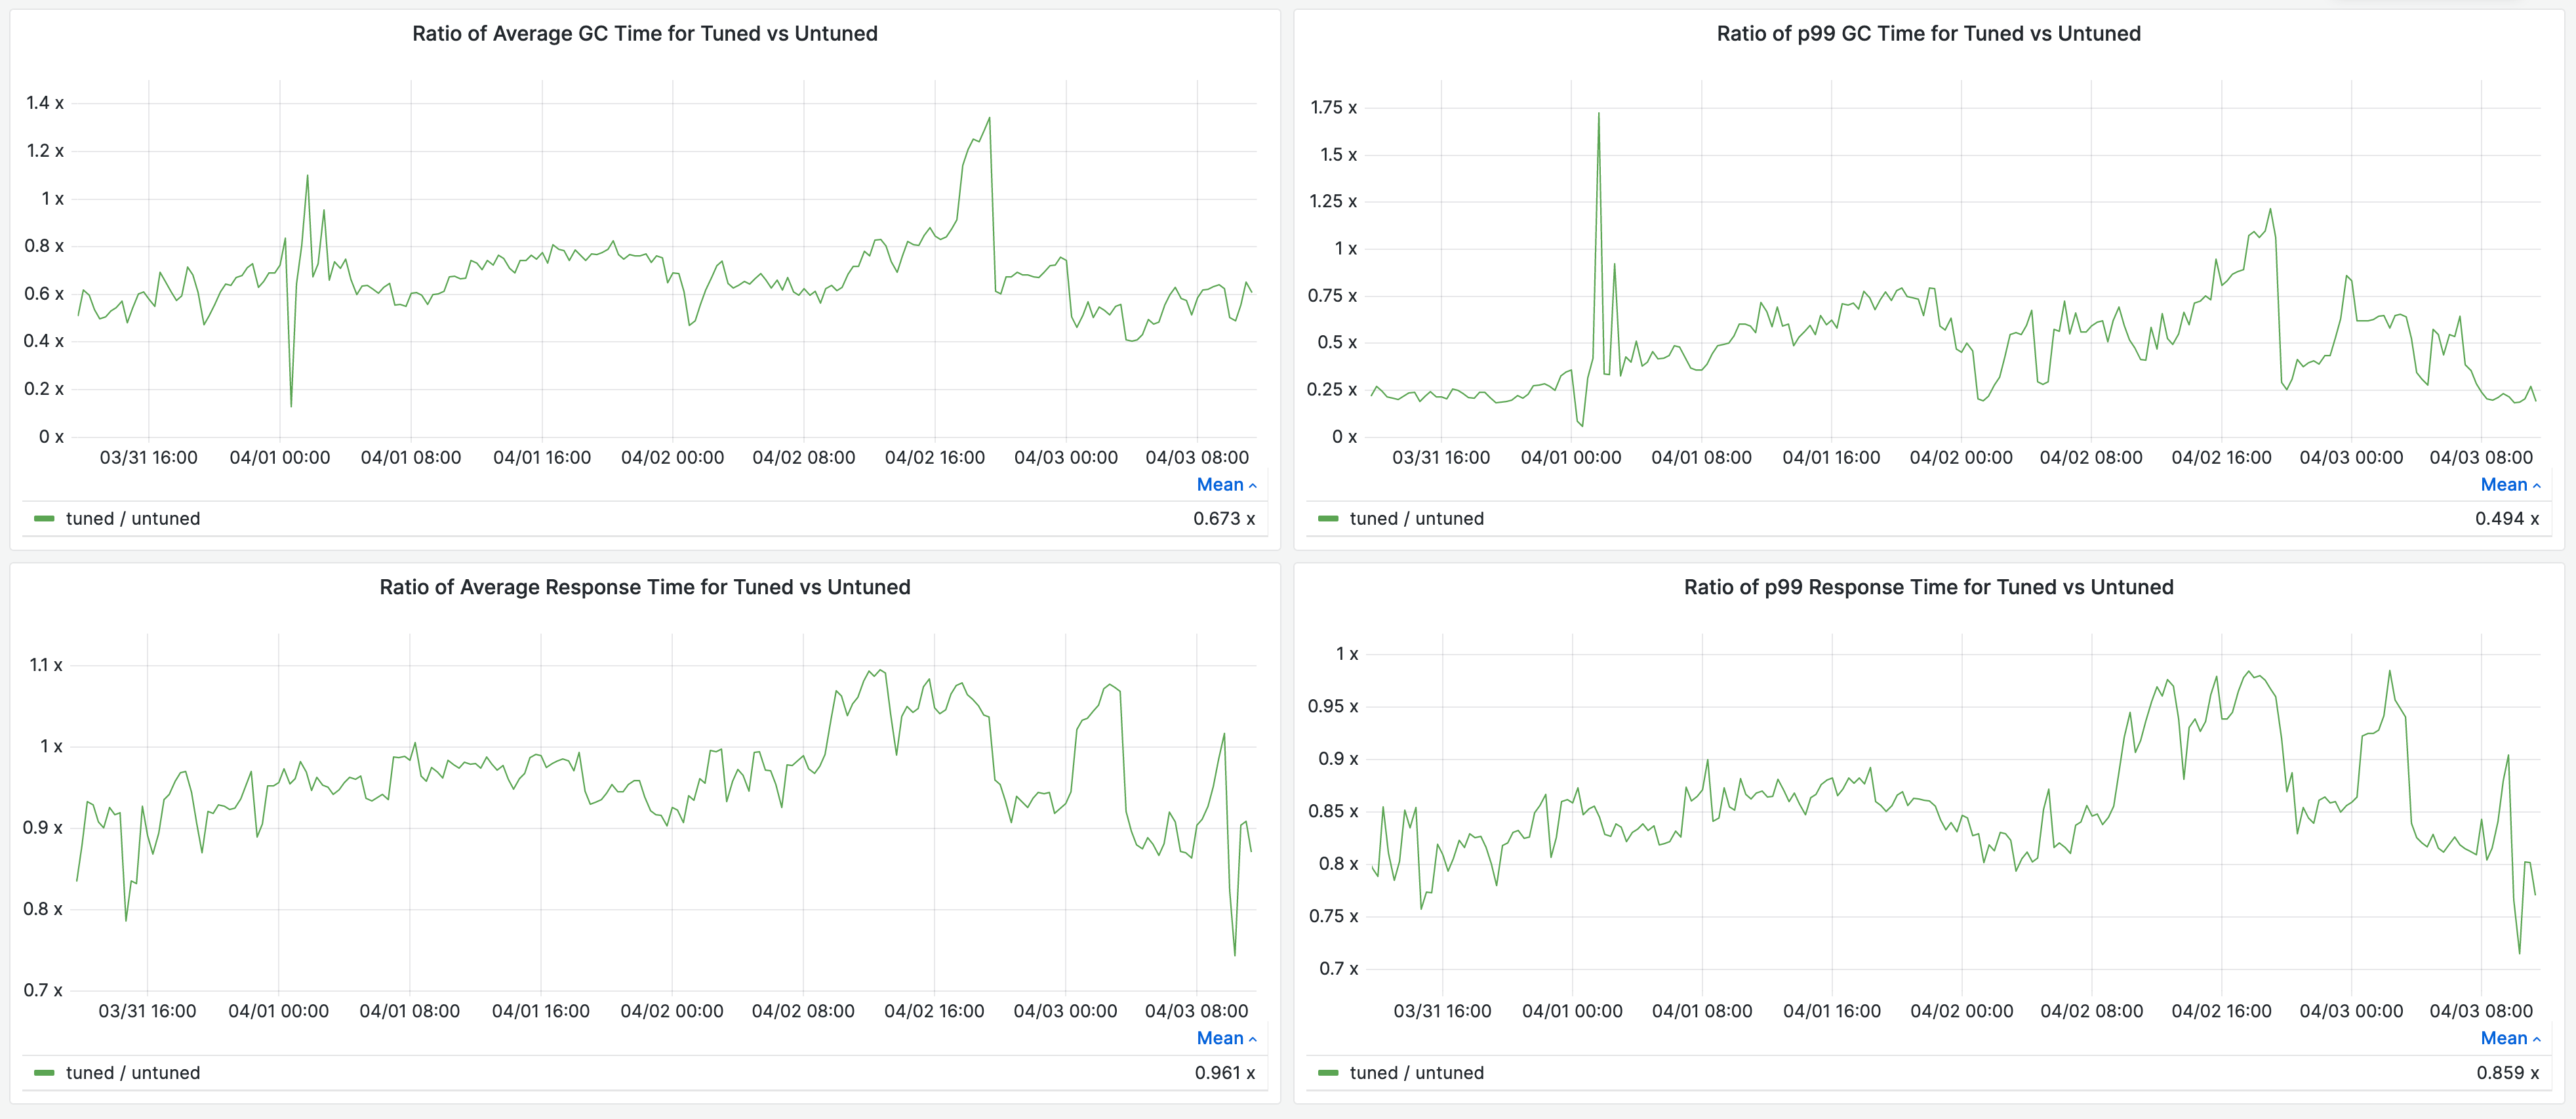
On one of Shopify's highest traffic Ruby apps, Storefront Renderer, we saw significant improvements after deploying this patch in production. In the graphs below, we have the tuned group which uses RUBY_GC_HEAP_REMEMBERED_WB_UNPROTECTED_OBJECTS_LIMIT_RATIO=0.01 (the default value), and an untuned group, which turns this feature off with RUBY_GC_HEAP_REMEMBERED_WB_UNPROTECTED_OBJECTS_LIMIT_RATIO=0. We see that the tuned group spends significantly less time in GC, on average 0.67x of the time compared to the untuned group and 0.49x for p99. We see this improvement in GC time translate to improvements in response times. The average response time is now 0.96x of the time compared to the untuned group and 0.86x for p99.
Files
") Updated by ko1 (Koichi Sasada) about 1 year ago
Updated by ko1 (Koichi Sasada) about 1 year ago
Could you make clear the following?
- Please describe how the new parameter is used and how the current implementation calculate without new parameter.
- my understanding is this parameter is used for the major GC condition.
- This new parameter can reduce major GC count (and this is why the figures show the results)
- Can we compare the major GC counts, unprotected objects count and memory footprint?
- Could you try with other parameters, from 0.10 to 0.50 for example?
Maybe this proposal is based on the assumption that "we can't collect unprotected objects in many cases so the collection rate (== major GC counts) should be reduced".
I agree this assumption in general. Can we make some kind of evidence?
Trivial comment:
This parameter is ratio for the "old objects" so I'm not sure it makes sense.
") Updated by peterzhu2118 (Peter Zhu) about 1 year ago
Updated by peterzhu2118 (Peter Zhu) about 1 year ago
how the new parameter is used and how the current implementation calculate without new parameter
The default value is 0.01 (1%). It's calculated as 1% of the old_objects count. You can see the implementation is:
objspace->rgengc.uncollectible_wb_unprotected_objects_limit = MAX(
    (size_t)(objspace->rgengc.uncollectible_wb_unprotected_objects * r),
    (size_t)(objspace->rgengc.old_objects * gc_params.uncollectible_wb_unprotected_objects_limit_ratio)
);
The original implementation only used the remembered_wb_unprotected_objects multiplied by RUBY_GC_HEAP_OLDOBJECT_LIMIT_FACTOR:
objspace->rgengc.uncollectible_wb_unprotected_objects_limit = (size_t)(objspace->rgengc.uncollectible_wb_unprotected_objects * r);
my understanding is this parameter is used for the major GC condition.
That is correct.
This new parameter can reduce major GC count (and this is why the figures show the results)
Yes, with this feature, the number of major GC ran in requests is about 0.37x compared to without this feature.
Can we compare the major GC counts, unprotected objects count and memory footprint?
We have very few unprotected objects, so our remembered_wb_unprotected_objects_limit was very low. This meant that we reached the limit very frequently, which triggered major GC very frequently. But because we have a lot of old objects, we have to scan a few million old objects and we only free a few thousand remembered WB unprotected objects. This caused poor p99 response times.
After this patch, the remembered_wb_unprotected_objects_limit is now 1% of the number of old objects, meaning that we don't trigger major GC as frequently.
In Storefront Renderer, we don't see a change in average or p99 memory usage within the margin of error.
Could you try with other parameters, from 0.10 to 0.50 for example?
We tried with 0.02 and we saw an increase in response times because it makes minor GC slower (since we have much more objects to scan in minor GC). We also found that a lower number (e.g. 0.005 or 0.0025) did not perform as well either. It seems that 0.01 is around the optimal value.
This parameter is ratio for the "old objects" so I'm not sure it makes sense.
Do you mean RUBY_GC_HEAP_OLDOBJECT_LIMIT_FACTOR being used to calculate remembered_wb_unprotected_objects_limit? I agree in this case. It is confusing that RUBY_GC_HEAP_OLDOBJECT_LIMIT_FACTOR is used to calculate both old_objects_limit and remembered_wb_unprotected_objects_limit.
Updated by ko1 (Koichi Sasada) about 1 year ago
We have very few unprotected objects, so our remembered_wb_unprotected_objects_limit was very low. This meant that we reached the limit very frequently, which triggered major GC very frequently. But because we have a lot of old objects, we have to scan a few million old objects and we only free a few thousand remembered WB unprotected objects. This caused poor p99 response times.
It makes sense. I understand this proposal introducing better lower-bound to kick the major gc because of remembered WB-unprotected objects.
They are not clear.
- ratio to the old objects is acceptable?
- how we confirm the 1% is best on default.
- I'm afraid that (as you said) 2% is too much but 0.5% is too short on the Shopify app it can hurts other applications.
To make analysis, can you logging measurements on each GC?
One example is using https://github.com/ko1/gc_tracer (but not sure it works on 3.3dev).
and culd you observe similar benefits on railsbench or other benchmarks?
To make it correctly, maybe we need to make a model and predict how many remembered WB-unprotect objects can be collected on the next major GC, and compare the costs with (1) minor gc performance because of remembered WB-unprotected objects (they are root objects) (2) major gc cost.
We also found that a lower number (e.g. 0.005 or 0.0025) did not perform as well either.
could you give us details? too many major gc because of it?
This parameter is ratio for the "old objects" so I'm not sure it makes sense.
Do you mean RUBY_GC_HEAP_OLDOBJECT_LIMIT_FACTOR being used to calculate remembered_wb_unprotected_objects_limit? I agree in this case. It is confusing that RUBY_GC_HEAP_OLDOBJECT_LIMIT_FACTOR is used to calculate both old_objects_limit and remembered_wb_unprotected_objects_limit.
I agree it is weird (I never think someone find this parameter).
Anyway, I meant that the name REMEMBERED_WB_UNPROTECTED_OBJECTS_LIMIT_RATIO seems it will be applied on the number of "REMEMBERED_WB_UNPROTECTED_OBJECTS" to calc the limit (not for the number of old objects).
Updated by peterzhu2118 (Peter Zhu) about 1 year ago
ratio to the old objects is acceptable?
Yes, I think using a ratio of old objects will allow it adapt to different situations. If there are very few old objects (e.g. 10k), then it doesn't take very long to run a major GC, so it's ok that the remembered_wb_unprotected_objects_limit is lower. But if there are a lot of old objects (e.g. 10M), then it takes a long time to run a major GC, so we should run as little major GC as possible by having a higher remembered_wb_unprotected_objects_limit. This will make minor GCs a bit slower, but it's much faster than running a major GC.
how we confirm the 1% is best on default.
The results we got with different values of RUBY_GC_HEAP_REMEMBERED_WB_UNPROTECTED_OBJECTS_LIMIT_RATIO was: 0 < 0.0025 < 0.005 < 0.02 < 0.01
We got the best results with 0.01 and worse results with 0.02 and 0.005. But 0.02 and 0.005 were all better than 0 (which is turned off).
To make analysis, can you logging measurements on each GC?
We log GC information, what kind of information are you looking for?
and could you observe similar benefits on railsbench or other benchmarks?
Benchmarks like railsbench don't generate enough remembered WB unprotected objects to ever trigger a major GC, so this patch made no difference in railsbench.
could you give us details? too many major gc because of it?
To clarify, numbers like 0.005 and 0.02 performed better than 0 (turned off), but 0.01 performed the best. But yes, we run less major GC which is where the significant improvement in p99 response times comes from. We run about 1/3 of the number of major GC with this feature.
Updated by peterzhu2118 (Peter Zhu) 11 months ago
- Status changed from Open to Closed
Applied in changeset git|a23ae56c4d24ade9438393fc47d6f2b730e3f7a8.
Add REMEMBERED_WB_UNPROTECTED_OBJECTS_LIMIT_RATIO
[Feature #19571]
This commit adds the environment variable
RUBY_GC_HEAP_REMEMBERED_WB_UNPROTECTED_OBJECTS_LIMIT_RATIO which is
used to calculate the remembered_wb_unprotected_objects_limit using a
ratio of old_objects. This should improve performance by reducing
major GC because, in a major GC, we mark all of the old objects, so we
should have more uncollectible WB unprotected objects before starting a
major GC. The default has been set to 0.01 (1% of old objects).
On one of Shopify's highest traffic Ruby apps, Storefront Renderer,
we saw significant improvements after deploying this patch in
production. In the graphs below, we have the tuned group which uses
RUBY_GC_HEAP_REMEMBERED_WB_UNPROTECTED_OBJECTS_LIMIT_RATIO=0.01 (the
default value), and an untuned group, which turns this feature off
with RUBY_GC_HEAP_REMEMBERED_WB_UNPROTECTED_OBJECTS_LIMIT_RATIO=0. We
see that the tuned group spends significantly less time in GC, on
average 0.67x of the time compared to the untuned group and 0.49x for
p99. We see this improvement in GC time translate to improvements in
response times. The average response time is now 0.96x of the time
compared to the untuned group and 0.86x for p99.