Bug #17263
closed")
Fiber context switch degrades with number of fibers, limit on number of fibers
Description
I'm working on developing Polyphony, a Ruby gem for writing
highly-concurrent Ruby programs with fibers. In the course of my work I have
come up against two problems using Ruby fibers:
- Fiber context switching performance seem to degrade as the number of fibers
is increased. This is both withFiber#transferand
Fiber#resume/Fiber.yield. - The number of concurrent fibers that can exist at any time seems to be
limited. Once a certain number is reached (on my system this seems to be
31744 fibers), callingFiber#transferwill raise aFiberErrorwith the
messagecan't set a guard page: Cannot allocate memory. This is not due to
RAM being saturated. With 10000 fibers, my test program hovers at around 150MB
RSS (on Ruby 2.7.1).
Here's a program for testing the performance of Fiber#transfer:
# frozen_string_literal: true

require 'fiber'

class Fiber
  attr_accessor :next
end

def run(num_fibers)
  count = 0

  GC.start
  GC.disable

  first = nil
  last = nil
  supervisor = Fiber.current
  num_fibers.times do
    fiber = Fiber.new do
      loop do
        count += 1
        if count == 1_000_000
          supervisor.transfer
        else
          Fiber.current.next.transfer
        end
      end
    end
    first ||= fiber
    last.next = fiber if last
    last = fiber
  end

  last.next = first

  t0 = Time.now
  first.transfer
  elapsed = Time.now - t0

  rss = `ps -o rss= -p #{Process.pid}`.to_i

  puts "fibers: #{num_fibers} rss: #{rss} count: #{count} rate: #{count / elapsed}"
rescue Exception => e
  puts "Stopped at #{count} fibers"
  p e
end

run(100)
run(1000)
run(10000)
run(100000)
With Ruby 2.6.5 I'm getting:
fibers: 100 rss: 23212 count: 1000000 rate: 3357675.1688139187
fibers: 1000 rss: 31292 count: 1000000 rate: 2455537.056439736
fibers: 10000 rss: 127388 count: 1000000 rate: 954251.1674325482
Stopped at 22718 fibers
#<FiberError: can't set a guard page: Cannot allocate memory>
With Ruby 2.7.1 I'm getting:
fibers: 100 rss: 23324 count: 1000000 rate: 3443916.967616508
fibers: 1000 rss: 34676 count: 1000000 rate: 2333315.3862491543
fibers: 10000 rss: 151364 count: 1000000 rate: 916772.1008060966
Stopped at 31744 fibers
#<FiberError: can't set a guard page: Cannot allocate memory>
With ruby-head I get an almost identical result to that of 2.7.1.
As you can see, the performance degradation is similar in all the three versions
of Ruby, going from ~3.4M context switches per second for 100 fibers to less
then 1M context switches per second for 10000 fibers. Running with 100000 fibers
fails to complete.
Here's a program for testing the performance of Fiber#resume/Fiber.yield:
# frozen_string_literal: true

require 'fiber'

class Fiber
  attr_accessor :next
end

# This program shows how the performance of Fiber.transfer degrades as the fiber
# count increases

def run(num_fibers)
  count = 0

  GC.start
  GC.disable

  fibers = []
  num_fibers.times do
    fibers << Fiber.new { loop { Fiber.yield } }
  end

  t0 = Time.now

  while count < 1000000
    fibers.each do |f|
      count += 1
      f.resume
    end
  end

  elapsed = Time.now - t0

  puts "fibers: #{num_fibers} count: #{count} rate: #{count / elapsed}"
rescue Exception => e
  puts "Stopped at #{count} fibers"
  p e
end

run(100)
run(1000)
run(10000)
run(100000)
With Ruby 2.7.1 I'm getting the following output:
fibers: 100 count: 1000000 rate: 3048230.049946255
fibers: 1000 count: 1000000 rate: 2362235.6455160403
fibers: 10000 count: 1000000 rate: 950251.7621725246
Stopped at 21745 fibers
#<FiberError: can't set a guard page: Cannot allocate memory>
As I understand it, theoretically at least switching between fibers should have
a constant cost in terms of CPU cycles, irrespective of the number of fibers
currently existing in memory. I am completely ignorant the implementation
details of Ruby fibers, so at least for now I don't have any idea where this
problem is coming from.
Files
") Updated by ioquatix (Samuel Williams) almost 6 years ago
Updated by ioquatix (Samuel Williams) almost 6 years ago
Regarding "can't set a guard page" it's because of your system is limiting the number of memory mapped segments. Each fiber stack requires a guard page and this is considered a separate memory map entry.
Try increasing it:
Regarding fiber context switching performance, you are correct it should be constant time no matter the number of fibers. What is not constant time is garbage collection, but it looks like you disabled that. I don't know why you are having such an experience, I need to check for myself what is going on.
Updated by ioquatix (Samuel Williams) almost 6 years ago
") Updated by Eregon (Benoit Daloze) almost 6 years ago
Updated by Eregon (Benoit Daloze) almost 6 years ago
- Description updated (diff)
Updated by ioquatix (Samuel Williams) almost 6 years ago
On my computer, I found the following.
I changed your script to run with the given number of fibers as an argument.
> sudo perf stat -e page-faults,cpu-cycles:u,cpu-cycles:k ./ruby ../test.rb 10000
fibers: 10000 rss: 143252 count: 1000000 rate: 1185760.5787558889

 Performance counter stats for './ruby ../test.rb 10000':

            37,162      page-faults
     3,134,456,066      cpu-cycles:u
       453,411,132      cpu-cycles:k

       0.961123393 seconds time elapsed

       0.846998000 seconds user
       0.107914000 seconds sys


> sudo perf stat -e page-faults,cpu-cycles:u,cpu-cycles:k ./ruby ../test.rb 100000
fibers: 100000 rss: 1302384 count: 1000000 rate: 670890.0627347956

 Performance counter stats for './ruby ../test.rb 100000':

           346,580      page-faults
     3,989,630,633      cpu-cycles:u
     4,084,402,671      cpu-cycles:k

       2.151275080 seconds time elapsed

       1.151921000 seconds user
       0.989052000 seconds sys


> sudo perf stat -e page-faults,cpu-cycles:u,cpu-cycles:k ./ruby ../test.rb 1000000
fibers: 1000000 rss: 12886240 count: 1000000 rate: 153311.38970854803

 Performance counter stats for './ruby ../test.rb 1000000':

         3,438,434      page-faults
     8,948,808,388      cpu-cycles:u
    35,212,243,043      cpu-cycles:k

      11.706676724 seconds time elapsed

       3.073442000 seconds user
       8.496062000 seconds sys
:u means user space and :k means kernel space.
Even thought the cpu-cycles is roughtly the same (and user time), we can see the system time varies by an order of magnitude. I had to run several times to get this clear picture, but I believe the overhead is coming from page-faults as the stacks are swapped. The more stacks you have, the more page faults you have in your L1/L2 cache. I'm not sure if we can verify this further, but one way might be to change the defaults stack size. I'll play around with it a bit more. Certainly, a CPU with a bigger L1/L2 cache should perform better if this theory is true.
Updated by ioquatix (Samuel Williams) almost 6 years ago
I've been meaning to revisit the x64 implementation to make it more memory friendly.
I played around with it today in my spare time. Here is updated implementation:
.globl PREFIXED_SYMBOL(SYMBOL_PREFIX,coroutine_transfer)
PREFIXED_SYMBOL(SYMBOL_PREFIX,coroutine_transfer):
	# Make space on the stack for 7 registers:
	subq $48, %rsp

	# Save caller stack pointer
	movq %rsp, (%rdi)

	# Save caller state:
	movq %rbp, 40(%rsp)
	movq %rbx, 32(%rsp)
	movq %r12, 24(%rsp)
	movq %r13, 16(%rsp)
	movq %r14, 8(%rsp)
	movq %r15, (%rsp)

	# Restore callee stack pointer
	movq (%rsi), %rsp

	# Move the return address into rax to start prefetching:
	movq 48(%rsp), %rax

	# Restore callee state
	# Save caller state:
	movq 40(%rsp), %rbp
	movq 32(%rsp), %rbx
	movq 24(%rsp), %r12
	movq 16(%rsp), %r13
	movq 8(%rsp), %r14
	movq (%rsp), %r15

	addq $56, %rsp

	# Put the first argument into the return value
	# movq %rdi, %rax

	# We pop the return address and jump to it
	jmpq %rax
	# ret
It seems to have a minor performance improvement, but still fundamentally exhibiting the same page fault behaviour.
") Updated by ciconia (Sharon Rosner) almost 6 years ago
Updated by ciconia (Sharon Rosner) almost 6 years ago
Please forgive me if this is a stupid question, but are fiber stacks in Ruby resizable? Can they grow or do they have a fixed size?
Updated by ioquatix (Samuel Williams) almost 6 years ago
You do not need to preface your questions like that.
The fiber stack is a fixed size, but it's allocated using virtual memory and it's "released" using madvise(DONT_NEED) which allows the kernel to release those pages. So whether you allocate fibers with a 1MiB stack or a 128MiB stack, the only difference is address space consumed which is almost free and the actual amount of stack used, rounded up to the nearest page. One part to be careful of is to ensure the GC knows the correct extent of the stack, otherwise it would page in the entire stack (mostly zeros).
") Updated by rmosolgo (Robert Mosolgo) over 4 years ago
Updated by rmosolgo (Robert Mosolgo) over 4 years ago
I heard someone ran into this error in a GraphQL-Ruby context, so I thought I'd check out this script on the latest Ruby. It didn't crash as-written, so I added a couple more orders of magnitude. It still finished fine locally, but slowed down in the same way described previously (iiuc). Here's the output of the script, reformatted for readability:
$ ruby -v
ruby 3.1.0p0 (2021-12-25 revision fb4df44d16) [x86_64-darwin19]
$ ruby fibers.rb
fibers: 100      rss: 13788    count: 1000000 rate: 4792967.757705894
fibers: 1000     rss: 25424    count: 1000000 rate: 4186447.6317265746
fibers: 10000    rss: 143384   count: 1000000 rate: 1308239.5543612782
fibers: 100000   rss: 1312544  count: 1000000 rate:  746528.2702790672
fibers: 1000000  rss: 12983392 count: 1000000 rate:  147636.8216863137
fibers: 10000000 rss: 21913812 count: 1000000 rate:   63403.92197640169
Just thought I'd share the behavior on 3.1.0 in case anyone else comes checking on this issue!
Updated by ioquatix (Samuel Williams) almost 3 years ago
The difference is negligible but there did appear to be some improvement. We obviously need better benchmark tools, because this is total eye-ball statistics, but it's expected that less memory dependency between instructions should be better.
Updated by ioquatix (Samuel Williams) almost 3 years ago
It looks like roughly 3 page faults per fiber. If I run x fibers, I get 3x page faults. It's proportional to the number of fibers, but I'm not sure how expensive this is.
The CPU time is also costly, for x fibers, I get 50000x kernel side CPU cycles. So for sure there is some overhead there. Hard to separate that from setup vs runtime though.
> sudo perf stat -e page-faults,cpu-cycles:u,cpu-cycles:k (which ruby) fiber.rb 100000
fibers: 100000     count: 1000000    rate: 2993069.28

 Performance counter stats for '/home/samuel/.rubies/ruby-3.2.1/bin/ruby fiber.rb 100000':

           323,536      page-faults
     2,249,302,328      cpu-cycles:u
     4,642,691,199      cpu-cycles:k

       1.302578116 seconds time elapsed

       0.439950000 seconds user
       0.838409000 seconds sys


> sudo perf stat -e page-faults,cpu-cycles:u,cpu-cycles:k (which ruby) fiber.rb 1000000
fibers: 1000000    count: 1000000    rate: 3029874.53

 Performance counter stats for '/home/samuel/.rubies/ruby-3.2.1/bin/ruby fiber.rb 1000000':

         3,210,454      page-faults
     5,704,584,641      cpu-cycles:u
    49,187,058,607      cpu-cycles:k

      10.457917495 seconds time elapsed

       1.122311000 seconds user
       9.121725000 seconds sys
Updated by ioquatix (Samuel Williams) almost 3 years ago
- File clipboard-202308251514-grqb1.png clipboard-202308251514-grqb1.png added
- File clipboard-202308251514-r7g4l.png clipboard-202308251514-r7g4l.png added
I ran some profiles to try and identify why it was so slow. What I found was vm_push_frame becomes slow.
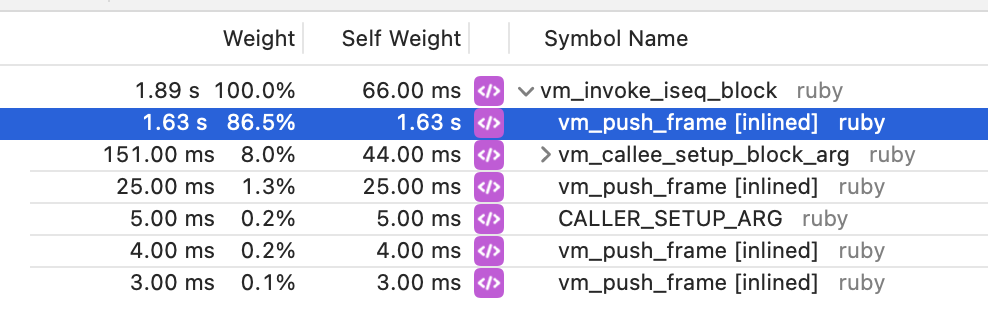
vs
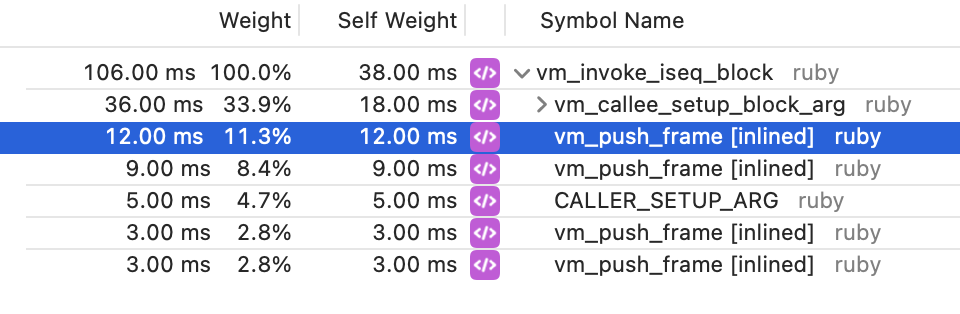
It's quite a big difference. I believe this is because of the virtual memory mapping.
I wonder if we could experimentally disable the guard pages to confirm this.
Updated by ioquatix (Samuel Williams) almost 3 years ago
1 million fibers is causing ~600GiB of virtual address space to be consumed. That seems like quite a lot:

I'm not surprised if this is causing the the OS to thrash/have issues.
Updated by ioquatix (Samuel Williams) almost 3 years ago
- Status changed from Open to Closed
My current conclusion is this:
Based on the perf cpu-cycles:k, we see proportional increase in overhead related to the number of fibers, despite ultimately having the same total number of context switches. This is unfortunate, but not exactly unexpected as we are stressing virtual memory.
Here are the results of my testing:
| fibers           | elapsed time (s) | rate (t/s)       |
| ---------------- | ---------------- | ---------------- |
|                1 |             0.91 |      10998609.17 |
|                2 |             0.82 |      12239077.16 |
|                4 |             0.77 |      12930013.16 |
|                8 |             0.79 |      12678091.91 |
|               16 |             0.79 |      12578625.99 |
|               32 |             0.79 |      12598729.93 |
|               64 |             0.79 |      12597254.54 |
|              128 |             0.79 |      12643086.20 |
|              256 |             0.83 |      12116891.53 |
|              512 |             0.94 |      10654248.57 |
|             1024 |             1.01 |       9865286.58 |
|             2048 |             1.04 |       9644781.53 |
|             4096 |             1.06 |       9455585.41 |
|             8192 |             1.10 |       9070485.29 |
|            16384 |             1.98 |       5054997.19 |
|            32768 |             3.14 |       3189286.37 |
|            65536 |             3.39 |       2949265.02 |
|           131072 |             3.39 |       2951698.03 |
|           262144 |             3.44 |       2910388.50 |
|           524288 |             3.43 |       2915666.38 |
|          1048576 |             3.43 |       2917077.46 |
I'm going to keep on investigating this issue, but I'm not sure there is anything we can fix in CRuby itself to address this. It looks like more of an OS level issue.
Script to generate the above table:
#!/usr/bin/env ruby

GC.disable

# This program shows how the performance of Fiber.transfer degrades as the fiber
# count increases

MAX = 2**20

FIBERS = []
MAX.times do
  fiber = Fiber.new{loop{Fiber.yield}}
  fiber.resume
  FIBERS << fiber
end

REPEATS = 10_000_000

def run(fibers, repeats = REPEATS)
  count = 0

  t0 = Process.clock_gettime(Process::CLOCK_MONOTONIC)

  while count < repeats
    fibers.each do |fiber|
      count += 1
      fiber.resume
    end
  end

  elapsed = Process.clock_gettime(Process::CLOCK_MONOTONIC) - t0
end

# Print results as a markdown table:
puts "| fibers           | elapsed time (s) | rate (t/s)       |"
puts "| ---------------- | ---------------- | ---------------- |"

21.times do |i|
  limit = 2**i
  fibers = FIBERS[0...limit]
  elapsed = run(fibers)
  rate = REPEATS / elapsed

  puts "| #{limit.to_s.rjust(16)} | #{sprintf("%0.2f", elapsed).rjust(16)} | #{sprintf("%0.2f", rate).rjust(16)} |"
end
") Updated by kjtsanaktsidis (KJ Tsanaktsidis) almost 3 years ago
Updated by kjtsanaktsidis (KJ Tsanaktsidis) almost 3 years ago
- File flamegraph_make_many_fibers.png flamegraph_make_many_fibers.png added
- File cache_misses_vs_time.png cache_misses_vs_time.png added
OK, so I spent way longer than I should have staring at this but I think I've worked out what's going on. There are a couple of separate fibers to unpick here (ba-dum tish); I'll look at making fibers and switching between fibers as separate issues.
Making lots of fibers
Firstly, the process of making lots of fibers (and switching to them for the first time) is kind of slow. To see what's going on here, I made the following script `make_many_fibers.rb:
# make_many_fibers.rb

GC.disable
MAX = 2**20
FIBERS = []
MAX.times do
  fiber = Fiber.new do
    loop do
      Fiber.yield
    end
  end
  fiber.resume
  FIBERS << fiber
end
And then ran it under perf to generate a combined userspace/kernelspace flamegrah:
sudo swapoff --all # make sure we don't get page faults from swap
echo madvise | sudo tee /sys/kernel/mm/transparent_hugepage/enable # make sure THP doesn't cause faults
echo -1 | sudo tee /proc/sys/kernel/perf_event_paranoid # allow unprivileged users to run perf
echo 1000000000 | sudo tee /proc/sys/vm/max_map_count # boost mapping count

% ruby --version
ruby 3.3.0dev (2023-09-05T08:35:28Z master 5b146eb5a1) [x86_64-linux]

perf record -F 999 -g -- ruby make_many_fibers.rb
perf script report flamegraph
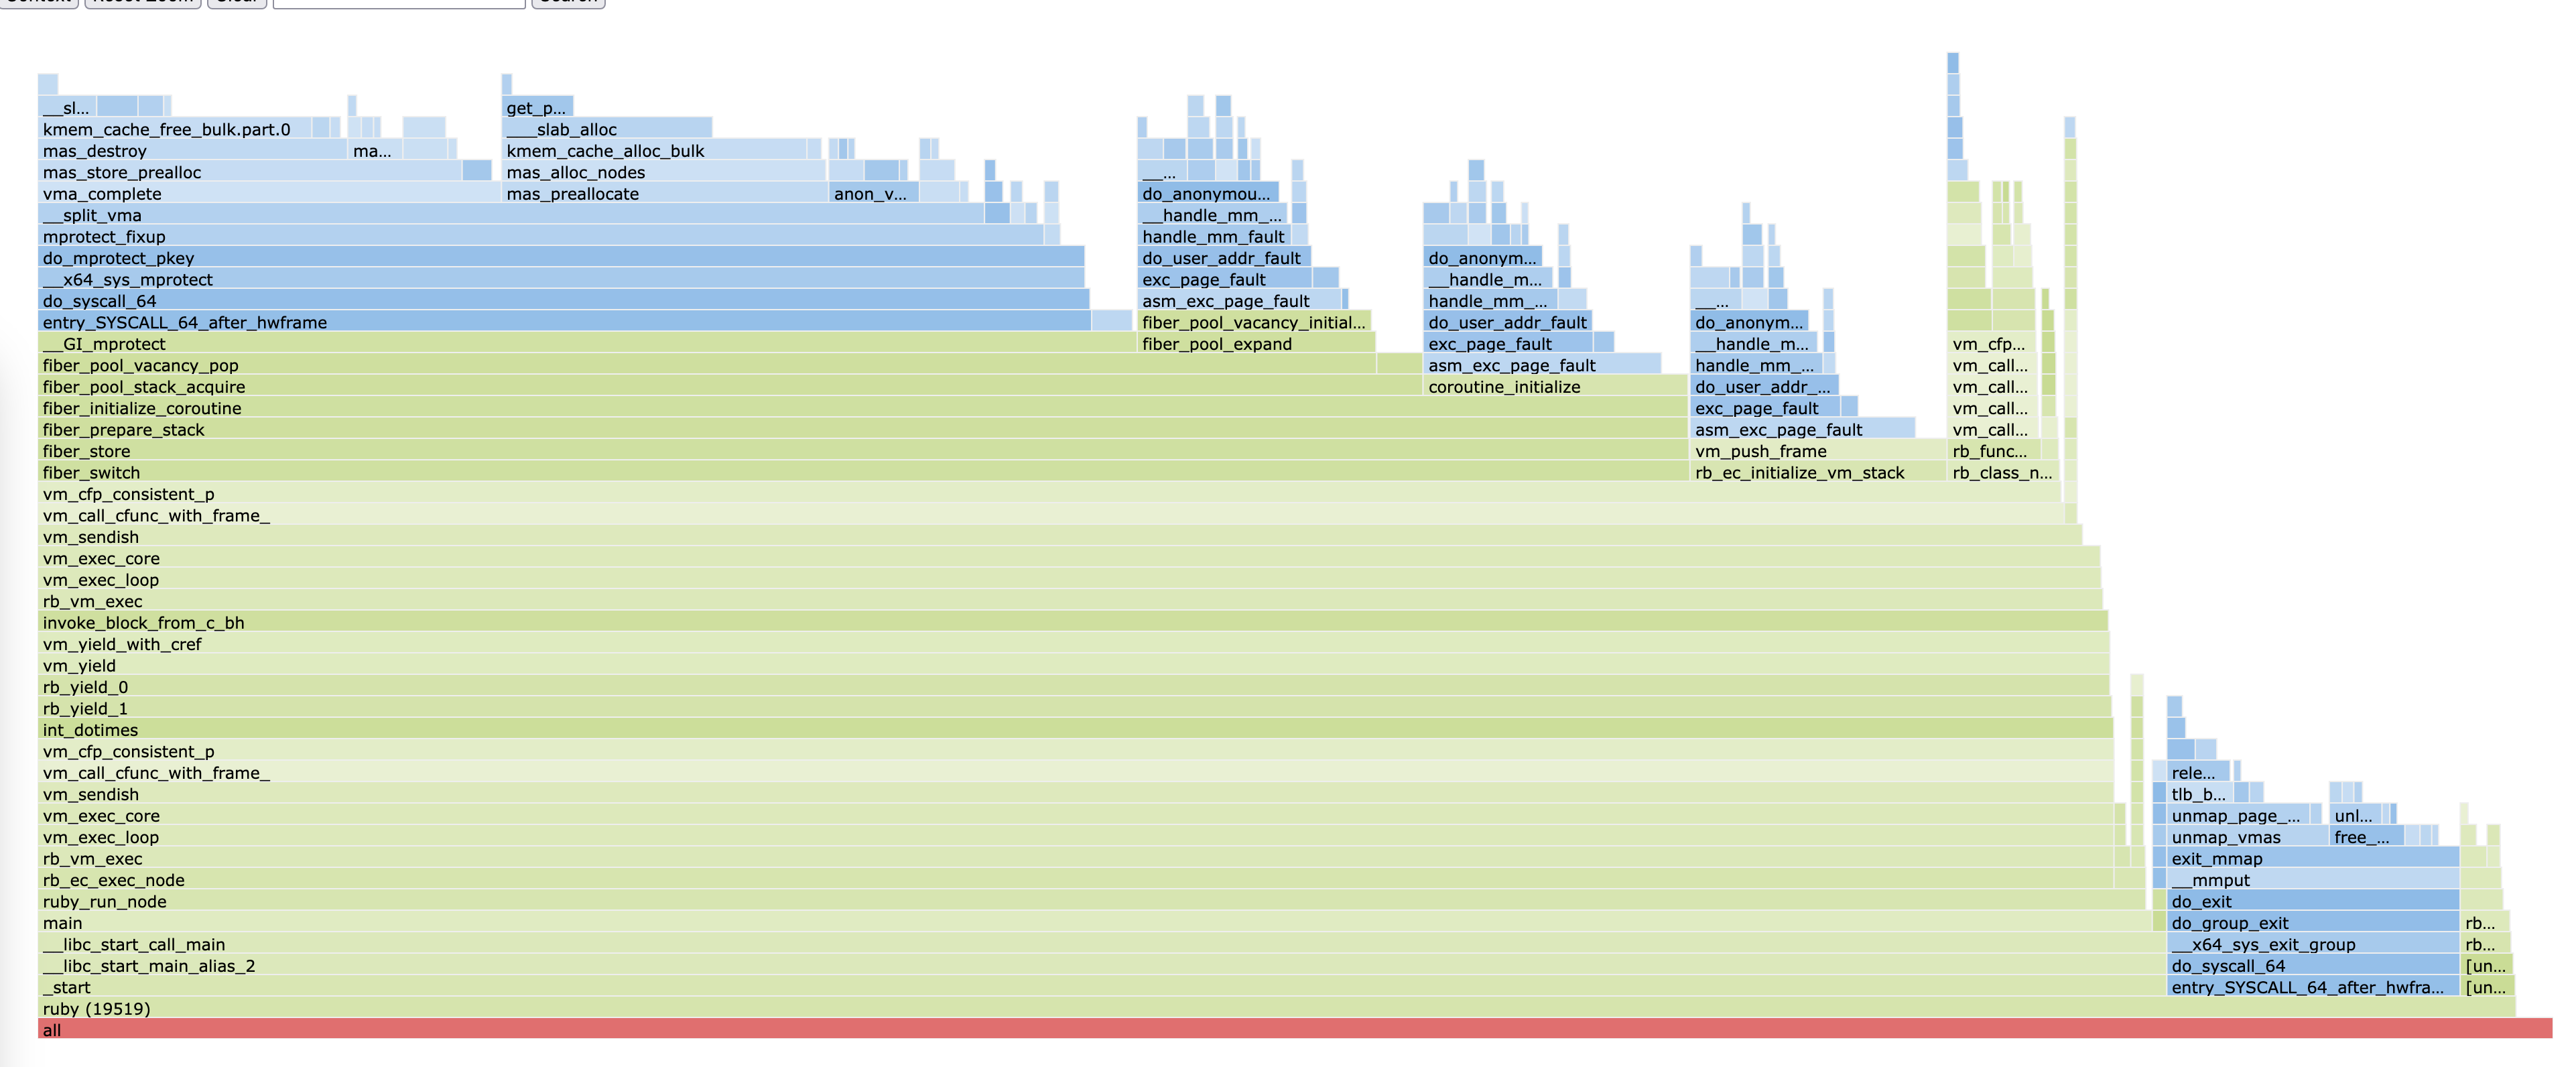
(Also you can look at the interactive HTML version)
You can see almost all of the time spent in the process of making fibers is in the kernel. A few things jump out at me.
Fiber memory mappings
Firstly, let's discuss the process of how memory is mapped for the fibers, in fiber_pool_expand. The code for this makes a single call to mmap(2) to produce a mapping large enough to hold a pool of fibers (up to 1024) - this happens in [fiber_pool_allocate_memory]https://github.com/ruby/ruby/blob/c87f2a4f156477ba962de19866a1f6298d567398/cont.c#L475). Then, we divide up that space for each fiber in fiber_pool_expand. Each fiber gets an area for its Ruby stack, for its C stack, and a "guard page" below the stack so that a fiber which tries to grow its native stack out of bounds generates a page fault instead of trashing some random memory. That guard page is marked non-readable and non-writable through a call to mprotect(2) here.
Despite this starting out as one mapping, on Linux a single memory mapping must actually have the same permissions for all pages in the mapping. Thus, when a page inside a mapping has its protection flags changed, the mapping must actualy be split up into three; an area before the page being changed, a mapping containing just the page being changed, and the area afterwards. We can see in the flamegraph that a huge amount of kernel time is spent in the call to mprotect, doing __split_vma.
Since we know ahead of time what the layout of the fiber pool's mappings is going to be, it might be worth experimenting with explicitly making two mmap calls per fiber; one to set up the memory needed, and one with the guard page. This would avoid the continous splitting as we mprotect the guard pages inside the one mapping.
Another thing we could try here is using mmap's MAP_GROWSDOWN option instead of explicitly making guard pages ourselves. The docs say that "this flag is used for stacks" and automatically allocates a guard page which will attempt to grow the mapping if hit. I haven't looked too hard at how it's implemented, but it might mean we can use a single mapping per fiber, with the guard page managed by the kernel.
Page faults
The second place we see a ton of kernel time being spent is in the page fault handler. This happens because when the mapping is created with mmap, the kernel doesn't actually back it with any memory; instead, it lazily waits for the application to try and access the memory range and only makes real memory available to the application then. We hit the page fault handler in two main places; coroutine_initialize (this is where the fiber's C stack is used for the first time), and vm_push_frame (this is where the fibers Ruby stack is used for the first time).
This is why, in the profile @ioquatix (Samuel Williams) shared before, we see more time in vm_push_frame. Each fibers first call to this method takes longer because it needs to allocate the initial page of Ruby stack. The original script in this issue makes more of the calls to vm_push_frame the initial call for a fiber because it has more fibers & the same number of iterations.
There isn't a whole lot which can be done about this overhead unfortunately. The only thing which would really make a difference here is using MAP_LOCKED to eagerly allocate all the real memory when the mapping is first made, but that would be extrodinarily wasteful of real system memory.
Transfering between existing fibers
Once the fibers are all created (and used for the first time, to fault in the stack), the assertion in the original issue is that it should be a constant-time operation to transfer between fibers, irrespective of tthe number of fibers in the application. However, the script in @ioquatix's last comment shows the rate of fiber-transfer operations dropping off as more fibers participate in the benchmark.
To debug this issue, I modified @ioquatix's script slightly to measure some performance counters with perf for each of the test iterations:
# transfer_many_fibers.rb

require 'open3'
require 'json'
require 'csv'

# This program shows how the performance of Fiber.transfer degrades as the fiber
# count increases


MAX = 2**20
FIBERS = []
MAX.times do
  fiber = Fiber.new do
    loop do
      Fiber.yield
    end
  end
  fiber.resume
  FIBERS << fiber
end

REPEATS = 10_000_000
PERF_COUNTERS = [
  'page-faults', 'major-faults', 'minor-faults',
  'cpu-cycles:u', 'cpu-cycles:k', 'cache-misses', 'cache-references',
  'L1-dcache-load-misses', 'L1-dcache-loads' ,'LLC-load-misses', 'LLC-loads',
  'dTLB-loads', 'dTLB-load-misses', 'dTLB-stores', 'dTLB-store-misses'
]

def with_perf_counters
  perf_cmd = [
    'perf', 'stat', '-e', PERF_COUNTERS.join(','),
    '-j', '-p', Process.pid.to_s, '-o', '/proc/self/fd/1'
  ]
  Open3.popen2(*perf_cmd) do |stdin, stdout, wait_thr|
    block_result = yield
    Process.kill :SIGINT, wait_thr.pid
    counters = {}
    stdout.each_line do |ln|
      parsed_ln = JSON.parse ln
      counters[parsed_ln['event']] = parsed_ln['counter-value'].to_i
    end
    wait_thr.value
    return [block_result, counters]
  end
end

def run(fibers, repeats = REPEATS)
  count = 0

  t0 = Process.clock_gettime(Process::CLOCK_MONOTONIC)

  while count < repeats
    fibers.each do |fiber|
      count += 1
      break if count >= repeats
      fiber.resume
    end
  end

  elapsed = Process.clock_gettime(Process::CLOCK_MONOTONIC) - t0
end

# Print results as a CSV table:
puts CSV.generate_line [
  'fibers', 'elapsed time (s)', 'rate (t/s)', *PERF_COUNTERS
]

GC.disable

21.times do |i|
  GC.start
  limit = 2**i
  fibers = FIBERS[0...limit]
  elapsed, perf_counters = with_perf_counters { run(fibers) }
  rate = REPEATS / elapsed

  puts CSV.generate_line [
    limit, elapsed, rate, *PERF_COUNTERS.map { perf_counters[_1] },
  ]
end
This generats a table like the previous comment, but also includes performance counter information from perf. I ran this as follows:
sudo swapoff --all # make sure we don't get page faults from swap
echo madvise | sudo tee /sys/kernel/mm/transparent_hugepage/enable # make sure THP doesn't cause faults
echo -1 | sudo tee /proc/sys/kernel/perf_event_paranoid # allow unprivileged users to run perf
echo 1000000000 | sudo tee /proc/sys/vm/max_map_count # boost mapping count

% ruby --version
ruby 3.3.0dev (2023-09-05T08:35:28Z master 5b146eb5a1) [x86_64-linux]

ruby transfer_many_fibers.rb
and obtained the following CSV data as a result:
fibers,elapsed time (s),rate (t/s),page-faults,major-faults,minor-faults,cpu-cycles:u,cpu-cycles:k,cache-misses,cache-references,L1-dcache-load-misses,L1-dcache-loads,LLC-load-misses,LLC-loads,dTLB-loads,dTLB-load-misses,dTLB-stores,dTLB-store-misses
1,1.4039703360003841,7122657.611476247,3,0,3,5859475245,12694559,3387,54987,165432,7146119413,650,16262,7145394321,4252,4601866193,7320
2,1.2886379399997168,7760131.600659063,1,0,1,5439823427,11350600,5964,55424,189086,6621658447,500,15200,6622892928,5438,4258132955,6574
4,1.258153214000231,7948157.576298307,0,0,0,5310310212,13089610,10449,68069,294892,6335968536,290,16860,6345118100,25997,4058742655,6802
8,1.253403425000215,7978277.225465762,0,0,0,5279962922,34494806,5446,51855,62076301,6192431913,900,16039,6179777983,44444,3939369328,6815
16,1.2689530819998254,7880512.007772858,0,0,0,5370474254,10763313,3844,47457,183940406,6102241668,765,16165,6103205916,26204,3910352255,6246
32,1.2346172180004942,8099676.445623648,0,0,0,5332621133,15694092,10154,64114,200680305,6063273925,462,15166,6068903340,38317,3883690997,11413
64,1.2704579209994336,7871177.655481325,0,0,0,5346794521,12588604,9447,56960,232002452,6059702410,638,15011,6058457551,17290,3878188080,8864
128,1.26315632800015,7916676.485983461,0,0,0,5343576341,12619817,30122,172656,254975275,6032357554,781,28931,6043258633,16401,3866060907,7708
256,1.3926949320002677,7180323.393320194,1,0,1,5946049052,16997016,232957,228631165,263358837,6037282294,1965,49843868,6038606356,14063,3867631144,7523
512,1.4688533830003507,6808031.431682799,0,0,0,6499307194,16462834,1098041,459635153,271677968,6042696127,5034,97729427,6041134724,1340316,3870403582,913873
1024,1.6829085890003626,5942093.388411512,0,0,0,7586548807,18469725,17423890,505379678,289076442,6049202803,558254,99886434,6055483248,10667121,3875545360,8659232
2048,2.458299625000109,4067852.3880096828,0,0,0,10614911431,34628829,125912094,586214908,293999643,6065587295,9686614,109485434,6074510477,12782326,3886950850,9275023
4096,3.8801752910003415,2577203.154505403,0,0,0,14523389421,54902097,332459456,565424689,294461987,6081202395,72540001,112161028,6082385994,18416444,3895766223,3191327
8192,4.739300166999783,2110016.172773987,0,0,0,16748731849,80070197,433472922,584586094,293148050,6082602630,93201829,114523043,6098901364,17956895,3898469812,4034203
16384,5.312199805000091,1882459.313858551,0,0,0,18067407945,89930922,494108236,594290763,292332035,6085798157,104621395,114785396,6094092659,17858483,3896705126,4349967
32768,5.714678685999388,1749879.6606884277,0,0,0,18954140751,57310406,520112168,600784408,292360264,6087857552,110260489,114733525,6089971523,17990727,3897881974,4273404
65536,5.85913169899959,1706737.5361621308,0,0,0,19225994828,58272894,527013755,601246452,292342290,6087916819,111582260,114827548,6091113925,18252983,3898391171,4059701
131072,5.90900381099982,1692332.6367440557,0,0,0,19223289411,60175735,530254916,600266994,292030029,6085240814,111810664,114751374,6084010298,18191953,3891766484,4108941
262144,5.8664713339994705,1704602.2098573,0,0,0,19168022353,66616904,531536818,601173015,291660876,6086962661,111537615,114434876,6090071817,17934617,3900912972,4454238
524288,5.871122640999602,1703251.7648613497,0,0,0,19239854173,74336965,531516412,601003077,291588311,6087162576,111521049,114462843,6092648529,17901966,3902304196,4484503
1048576,5.919364534000124,1689370.5299886826,0,0,0,19290077173,162339116,532576986,603934645,291400193,6088300500,111567224,114528793,6087885216,17794051,3898248975,4611646
Page faults
Firstly, the number of page faults in the transfer process is zero. This is expected; each of these fibers was already resumed once at the top of the script, so their stacks are faulted in. Thus, transferring between them incurs no page fault.
(sidebar: My initial version of this test actually did generate a large number of page faults. Eventually, I worked out it was because I was running the script as root. Ruby's Process.spawn uses vfork(2) to create the new process to be executed normally, BUT it uses fork(2) when the process is privileged. When you use real fork to make a new process, Linux marks all of your memory pages as read-only, so they can be shared with the just-forked process with copy-on-write semantics - even though the child process calls exec(2) straight afterwards! The next time your process tries to write to a page, it takes a page fault. The fault handler works out that the page is no longer shared (since the child process exec'd) and marks it as writable again. Anyway I spent hours trying to find out where these faults were coming from... glad I did though!)
Cache misses
Based on this data, my assessment is that the scenarios with more fibers involved in the transfer dance are slower because they put more pressure on the CPU's various caches. It's quite confusing what all the various cache measurements mean, but I think the cache-misses metric measures all memory accesses which missed all the caches, based on this Stackoverflow answer.
It seems that the overall time spent on the benchmark is very strongly correlated to the total cache-misses:
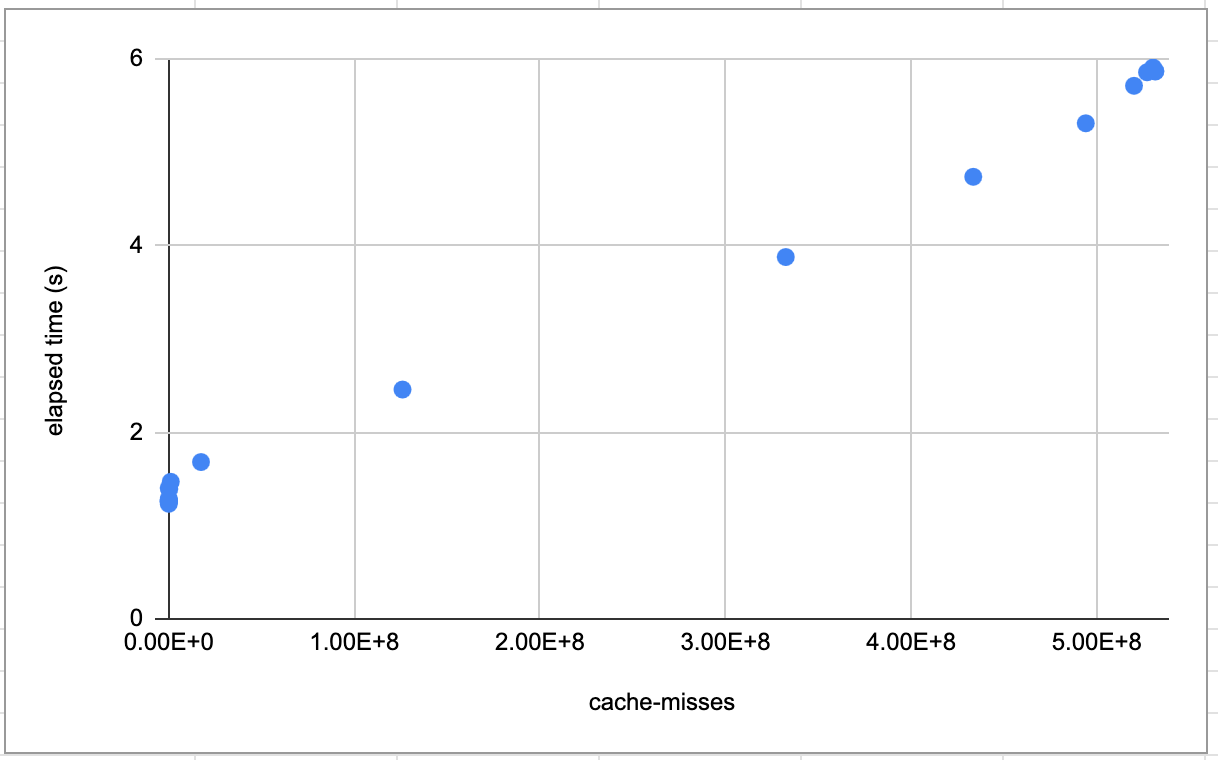
Based on this, I believe transfering between multiple fibers in this benchmark gets slower because each fiber has its stack in a different part of the system's memory, and so with many fibers you're far less likely to get a CPU cache hit when loading that fibers stack.
I don't think there's really anything which can be done here; working on large amounts of data or instructions which don't fit into CPU cache is always much slower than smaller bits which do. This benchmark is particuarly pathalogical because all it does is flip between fibers; in a real application hopfully the CPU caches would quickly be filled up with some relevant data for the fiber that's running.
Conclusion
I think it's worth experimenting with manually making a single MAP_GROWSDOWN mapping per fiber to see if that can improve fiber creation time by avoiding having the kernel split the mappings sequentially. However, I don't think there's a real problem with fiber transfers once the fibers have been created.