Bug #19596
closed")
Decreased performance after upgrading from ruby 2.7.2 to ruby 3.2.2
Description
I just upgraded to ruby 3.2.2 from 2.7.2 in one Rails app in production.
Tried with and without YJIT, but no matter what, I'm having worst performance.
Time spent in ruby went from 20ms to more than 50ms and very inconsistent (peaks)
- I'm using RVM
- I've set MALLOC_ARENAS_MAX=2
I may be wrong, but I suspect I have worst performance because I see this chart in newrelic increased right after the upgrade

In the picture, the chart has the "ruby" toggle, to see how much time is spent in ruby operations.
But I don't see a noticeable impact on the overall response times. So that makes me think that maybe, ruby 3.2 reports differently than 2.7 in newrelic

Right now, I'm using YJIT, and I was expecting to see some kind of improvements in app performance upgrading from 2.7 to 3.2 YJIT, but there's no performance gain, is that even possible?
The website is https://profe.social, it's a very standard content site, no super expensive ruby computations, most operations are rendering erb views pulling data from the database.
Any Ideas how can I get performance improvements?
Best regards.
Files
") Updated by k0kubun (Takashi Kokubun) about 3 years ago
Updated by k0kubun (Takashi Kokubun) about 3 years ago
I see that the time spent on Ruby is increased. I'd like to see the breakdown of the Ruby part. Can you try turning on GC metrics? Also, using their Thread profiler could give you more insights into what became worse.
You'd need to compare these metrics between 3.2 and the previous version. If possible, it'd be nice to compare them between 3.1 and 3.2. That would rule out potential problems in older versions.
") Updated by byroot (Jean Boussier) about 3 years ago
Updated by byroot (Jean Boussier) about 3 years ago
With the information provided it's impossible to tell what is wrong.
As @k0kubun (Takashi Kokubun) suggested, you should profile your application on both version to see if some code is disproportionately slow on 3.2 vs 2.7.
Updated by byroot (Jean Boussier) about 3 years ago
But I don't see a noticeable impact on the overall response times. So that makes me think that maybe, ruby 3.2 reports differently than 2.7 in newrelic
Yes, extremely likely. Can you show the whole breakdown and not just the "ruby" part? If response time stayed similar but "ruby" went up, it means other parts went up.
I suspect it's simply that you version of New Relic is no longer hooking properly in one of the libraries you use for IOs (e.g. redis/memcached/db).
") Updated by silva96 (Benjamín Silva) about 3 years ago
Updated by silva96 (Benjamín Silva) about 3 years ago
- File clipboard-202304130930-c24f0.png clipboard-202304130930-c24f0.png added
- File clipboard-202304130936-vtuwy.png clipboard-202304130936-vtuwy.png added
- File 4511491.json 4511491.json added
- File clipboard-202304130938-rj5ny.png clipboard-202304130938-rj5ny.png added
byroot (Jean Boussier) wrote in #note-3:
But I don't see a noticeable impact on the overall response times. So that makes me think that maybe, ruby 3.2 reports differently than 2.7 in newrelic
Yes, extremely likely. Can you show the whole breakdown and not just the "ruby" part? If response time stayed similar but "ruby" went up, it means other parts went up.
I suspect it's simply that you version of New Relic is no longer hooking properly in one of the libraries you use for IOs (e.g. redis/memcached/db).
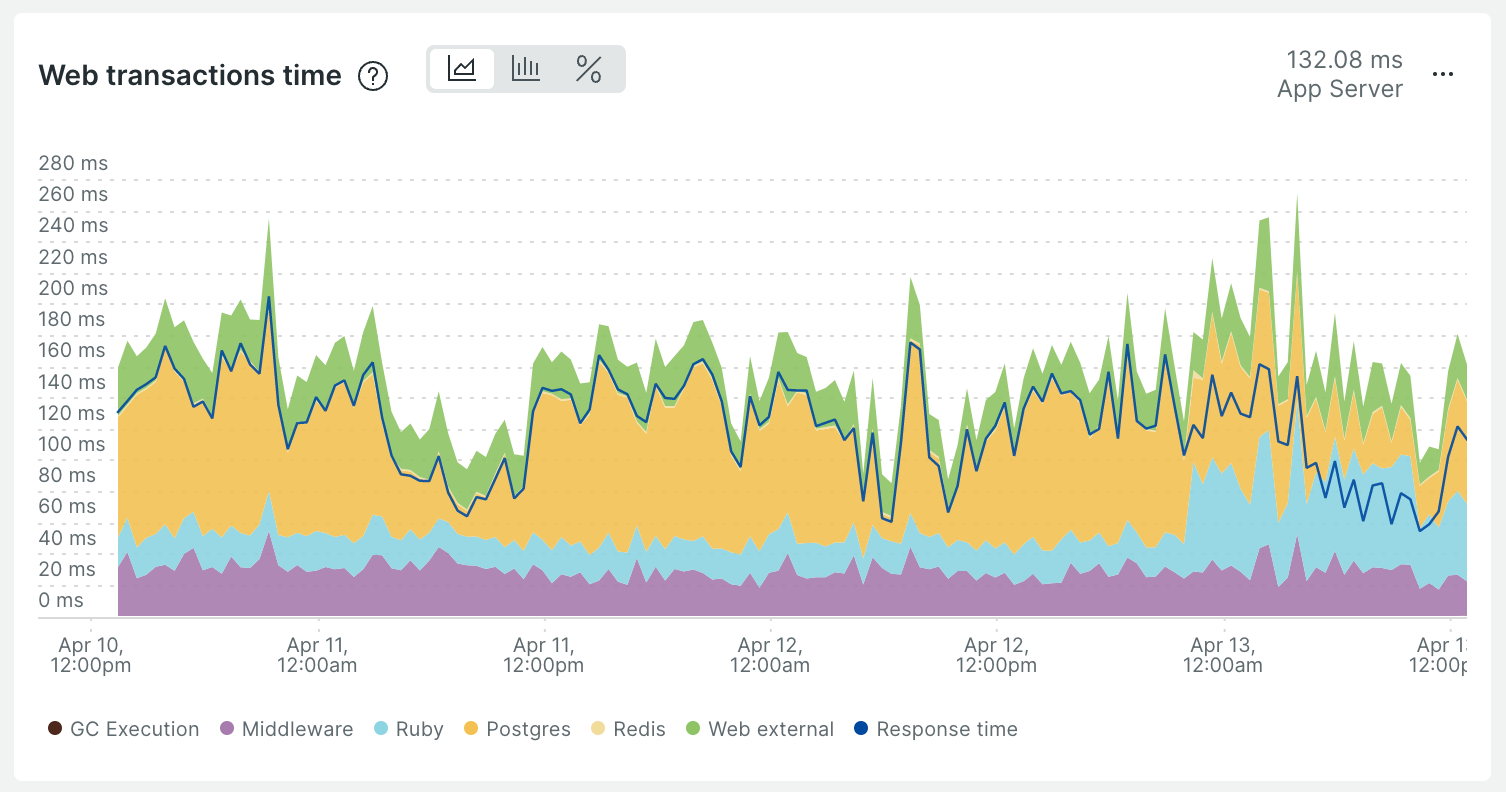
Here's the whole breakdown for the past 3 days.
Also, here's a profiling session:

(Also attached the whole JSON)[https://bugs.ruby-lang.org/attachments/9467]
And this is the GC Execution I just enabled:

Updated by byroot (Jean Boussier) about 3 years ago
- Status changed from Open to Closed
Ok, so as expected, where Ruby is up Postgres is down. This is very likely be to be caused by how NewRelic attribute time to either. I suspect it's when we changed the profiling API in 3.0 to show the C frames.
Either way, I don't think there is any performance degradation here, just different (likely more accurate) reporting.
") Updated by Eregon (Benoit Daloze) about 3 years ago
Updated by Eregon (Benoit Daloze) about 3 years ago
The Response time no longer being the total of everything except Web external seems to make it clear this is a NewRelic issue. Maybe something is getting counted twice or so.