Bug #19424
closed")
Significant performance decreases in `OpenStruct#marshal_load` in Ruby 3.0 and 3.1
Added by sumitdey035 (Sumit Dey) over 3 years ago. Updated about 3 years ago.
Description
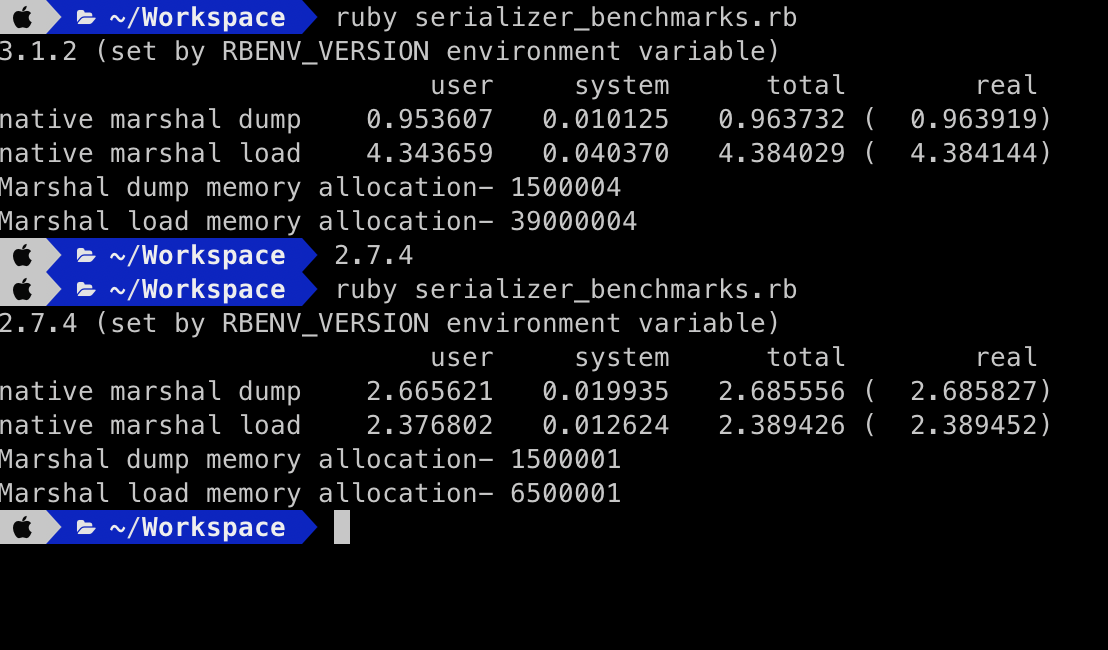
I can see degradation in Marshal load only in Ruby 3.1.2 compared to 2.7.4
Processing time increased by 200%(2.4 sec to 4.3 sec)
Memory allocation increased by 600%(6500001 to 39000004)
require 'benchmark'
require 'ostruct'
N_OJ = 500_000
ex_HASH = { 'one' => 1, 'array' => [ true, false ] }
ex_JSON = '{ "one": 1, "array": [ true, false ] }'
ex_STRUCT = OpenStruct.new( one: 1, hash: ex_HASH, array: [ true, false ] )
ex_MARSHAL = "\x04\bU:\x0FOpenStruct{\b:\bonei\x06:\thash{\aI\"\bone\x06:\x06ETi\x06I\"\narray\x06;\bT[\aTF:\narray[\aTF"
"-----------------Ruby #{system("rbenv version")}----------------"
Benchmark.bm(20) do |x|
x.report('native marshal dump') do
N_OJ.times do
y = Marshal.dump(ex_STRUCT)
end
end
x.report('native marshal load') do
N_OJ.times do
y = Marshal.load(ex_MARSHAL)
end
end
start_memory = GC.stat[:total_allocated_objects]
N_OJ.times do
y = Marshal.dump(ex_STRUCT)
end
end_memory = GC.stat[:total_allocated_objects]
print "Marshal dump memory allocation- #{end_memory - start_memory}\n"
start_memory = GC.stat[:total_allocated_objects]
N_OJ.times do
y = Marshal.load(ex_MARSHAL)
end
end_memory = GC.stat[:total_allocated_objects]
print "Marshal load memory allocation- #{end_memory - start_memory}\n"
end```
**Benchmark and Memory consumption result**

Files
| Screenshot 2023-02-07 at 1.04.49 PM.png (184 KB) Screenshot 2023-02-07 at 1.04.49 PM.png | sumitdey035 (Sumit Dey), 02/08/2023 08:59 AM |
") Updated by jeremyevans0 (Jeremy Evans) over 3 years ago
Actions
#1
[ruby-core:112338]
Updated by jeremyevans0 (Jeremy Evans) over 3 years ago
Actions
#1
[ruby-core:112338]
- Subject changed from Degradation in **Marshal load** only in Ruby 3.1.2 compared to 2.7.4 to Significant performance decreases in `OpenStruct#marshal_load` in Ruby 3.0 and 3.1
I was able to reproduce the issue. It seems to be limited to OpenStruct. Here's a simpler example:
require 'benchmark'
require 'ostruct'

n = 100_000
obj = OpenStruct.new( one: nil )

Benchmark.bm(20) do |x|
  klass = obj.class
  x.report("#{klass} dump") do
    n.times do
      Marshal.dump(obj)
    end
  end

  m = Marshal.dump(obj)
  x.report("#{klass} load") do
    n.times do
      Marshal.load(m)
    end
  end
end
with results:
$ ruby27 -v t.rb && ruby30 -v t.rb && ruby31 -v t.rb
ruby 2.7.7p221 (2022-11-24 revision 168ec2b1e5) [x86_64-openbsd]
                           user     system      total        real
OpenStruct dump        0.520000   0.000000   0.520000 (  0.523775)
OpenStruct load        0.370000   0.000000   0.370000 (  0.376001)
ruby 3.0.5p211 (2022-11-24 revision ba5cf0f7c5) [x86_64-openbsd]
                           user     system      total        real
OpenStruct dump        0.540000   0.000000   0.540000 (  0.537673)
OpenStruct load        1.590000   0.000000   1.590000 (  1.595759)
ruby 3.1.3p185 (2022-11-24 revision 1a6b16756e) [x86_64-openbsd]
                           user     system      total        real
OpenStruct dump        0.550000   0.000000   0.550000 (  0.556089)
OpenStruct load        2.240000   0.000000   2.240000 (  2.243714)
Ruby 3.2 performance is about the same as Ruby 3.1.
") Updated by byroot (Jean Boussier) over 3 years ago
Actions
#2
[ruby-core:112343]
Updated by byroot (Jean Boussier) over 3 years ago
Actions
#2
[ruby-core:112343]
Is this a regression in Marshal.load or in OpenStruct#marshal_load?
2.7 ships with ostruct 0.2.0 and 3.0 ships with ostruct 0.3.1.
Either trying ostruct 0.2.0 with Ruby 3.0 or ostruct 0.3.1 with Ruby 2.7 should tell use where to look.
Updated by byroot (Jean Boussier) over 3 years ago
Actions
#3
[ruby-core:112344]
Ok, after a quick spelunking, it's very clearly a result of https://github.com/ruby/ostruct/commit/014844ad7ccad408634263826e6da175e492f768
Prior to version 0.3.0 OpenStruct#marshal_load would simply assign a ivar, and accessors where provided by method_missing.
But in 0.3.0, accessors are now eagerly defined with define_method, so now loading a serialized instance require to define many methods.
I think that if you benchmark OpenStruct.new you'd see a similar performance difference.
Updated by jeremyevans0 (Jeremy Evans) over 3 years ago
Actions
#4
[ruby-core:112345]
byroot (Jean Boussier) wrote in #note-2:
Is this a regression in
Marshal.loador inOpenStruct#marshal_load?2.7 ships with
ostruct 0.2.0and3.0ships withostruct 0.3.1.Either trying
ostruct 0.2.0with Ruby 3.0 orostruct 0.3.1with Ruby 2.7 should tell use where to look.
With the current version of ostruct 0.5.5 installed for all Ruby versions, it looks like there is a still a decrease in performance in Ruby 3.0, but no decrease in 3.1.
$ ruby27 -v t.rb && ruby30 -v t.rb && ruby31 -v t.rb
ruby 2.7.7p221 (2022-11-24 revision 168ec2b1e5) [x86_64-openbsd]
["OpenStruct::VERSION", "0.5.5"]
                           user     system      total        real
OpenStruct dump        0.520000   0.000000   0.520000 (  0.520580)
OpenStruct load        1.360000   0.000000   1.360000 (  1.362451)
ruby 3.0.5p211 (2022-11-24 revision ba5cf0f7c5) [x86_64-openbsd]
["OpenStruct::VERSION", "0.5.5"]
                           user     system      total        real
OpenStruct dump        0.540000   0.000000   0.540000 (  0.539436)
OpenStruct load        2.120000   0.000000   2.120000 (  2.271033)
ruby 3.1.3p185 (2022-11-24 revision 1a6b16756e) [x86_64-openbsd]
["OpenStruct::VERSION", "0.5.5"]
                           user     system      total        real
OpenStruct dump        0.550000   0.000000   0.550000 (  0.559946)
OpenStruct load        2.190000   0.010000   2.200000 (  2.213022)
So part of the issue is ostruct (due to the commit mentioned), and part of the issue appears to be Marshal.load changes in 3.0.
Updated by byroot (Jean Boussier) over 3 years ago
Actions
#5
[ruby-core:112346]
That Ruby 3.0+ difference is likely due to the if defined? Ractor branching in the gem. On 3.0 it has to do even more work to make the defined methods Ractor safe.
Updated by jeremyevans0 (Jeremy Evans) over 3 years ago
Actions
#6
[ruby-core:112347]
jeremyevans0 (Jeremy Evans) wrote in #note-4:
So part of the issue is
ostruct(due to the commit mentioned), and part of the issue appears to beMarshal.loadchanges in 3.0.
Well, not Marshal.load, but the initialization approach ostruct switched to became slower in Ruby 3.0. New benchmark:
require 'benchmark'
gem 'ostruct'
require 'ostruct'
p ["OpenStruct::VERSION", OpenStruct::VERSION]

n = 100_000
obj = OpenStruct.new( one: nil )

Benchmark.bm(20) do |x|
  klass = obj.class
  x.report("#{klass} dump") do
    n.times do
      Marshal.dump(obj)
    end
  end

  m = Marshal.dump(obj)
  x.report("#{klass} load") do
    n.times do
      Marshal.load(m)
    end
  end

  x.report("#{klass} new") do
    n.times do
      OpenStruct.new( one: nil )
    end
  end
end
output:
ruby 2.7.7p221 (2022-11-24 revision 168ec2b1e5) [x86_64-openbsd]
["OpenStruct::VERSION", "0.5.5"]
                           user     system      total        real
OpenStruct dump        0.510000   0.010000   0.520000 (  0.518952)
OpenStruct load        1.390000   0.000000   1.390000 (  1.389447)
OpenStruct new         1.000000   0.000000   1.000000 (  1.016224)
ruby 3.0.5p211 (2022-11-24 revision ba5cf0f7c5) [x86_64-openbsd]
["OpenStruct::VERSION", "0.5.5"]
                           user     system      total        real
OpenStruct dump        0.520000   0.000000   0.520000 (  0.537284)
OpenStruct load        2.190000   0.000000   2.190000 (  2.191907)
OpenStruct new         1.680000   0.000000   1.680000 (  1.679188)
ruby 3.1.3p185 (2022-11-24 revision 1a6b16756e) [x86_64-openbsd]
["OpenStruct::VERSION", "0.5.5"]
                           user     system      total        real
OpenStruct dump        0.580000   0.000000   0.580000 (  0.562538)
OpenStruct load        2.210000   0.000000   2.210000 (  2.242819)
OpenStruct new         1.650000   0.000000   1.650000 (  1.672738)
Updated by jeremyevans0 (Jeremy Evans) over 3 years ago
Actions
#7
[ruby-core:112348]
byroot (Jean Boussier) wrote in #note-5:
That Ruby 3.0+ difference is likely due to the
if defined? Ractorbranching in the gem. On 3.0 it has to do even more work to make the defined methods Ractor safe.
Presumably that is not something we would want to revert.
I checked and performance with the 2.7 version of ostruct remains the same in Ruby 3.0 and 3.1:
ruby 2.7.7p221 (2022-11-24 revision 168ec2b1e5) [x86_64-openbsd]
["OpenStruct::VERSION", "0.2.0"]
                           user     system      total        real
OpenStruct dump        0.540000   0.000000   0.540000 (  0.525649)
OpenStruct load        0.400000   0.000000   0.400000 (  0.374714)
OpenStruct new         0.120000   0.000000   0.120000 (  0.122805)
ruby 3.0.5p211 (2022-11-24 revision ba5cf0f7c5) [x86_64-openbsd]
["OpenStruct::VERSION", "0.2.0"]
                           user     system      total        real
OpenStruct dump        0.520000   0.000000   0.520000 (  0.533818)
OpenStruct load        0.500000   0.000000   0.500000 (  0.489260)
OpenStruct new         0.130000   0.000000   0.130000 (  0.132554)
ruby 3.1.3p185 (2022-11-24 revision 1a6b16756e) [x86_64-openbsd]
["OpenStruct::VERSION", "0.2.0"]
                           user     system      total        real
OpenStruct dump        0.560000   0.000000   0.560000 (  0.560805)
OpenStruct load        0.510000   0.000000   0.510000 (  0.515713)
OpenStruct new         0.150000   0.000000   0.150000 (  0.134401)
The only issue is the version of ostruct that shipped with Ruby 2.7 (0.2.0) is not available as a gem, so users that want to use that version to improve load/new performance cannot do so. However, the ostruct 0.1.0 release that shipped with Ruby 2.6 is available as a gem and offers similar load/new performance.
Updated by byroot (Jean Boussier) over 3 years ago
Actions
#8
[ruby-core:112349]
Yes, I'm trying to pinpoint the change that made the eager definition of these methods, to try to figure out the rationale.
That said I'm doing so purely for curiosity, where I stand OpenStruct is fine quick mocks and such, but it can't possibly have decent performance. So between slow and slower...
Updated by byroot (Jean Boussier) over 3 years ago
Actions
#9
[ruby-core:112350]
Seems like the answer is here: https://bugs.ruby-lang.org/issues/15409#note-9 / https://github.com/ruby/ostruct/pull/15
The performance concern is even part of the OpenStruct documentation.
Updated by jeremyevans0 (Jeremy Evans) over 3 years ago
Actions
#10
[ruby-core:112351]
- Status changed from Open to Closed
I'm going to close this. If OpenStruct load/new performance is critical in your environment, then please stick with ostruct 0.1.0.
") Updated by Eregon (Benoit Daloze) over 3 years ago
Actions
#11
[ruby-core:112366]
Updated by Eregon (Benoit Daloze) over 3 years ago
Actions
#11
[ruby-core:112366]
Agreed, OpenStruct shouldn't be used for any performance-sensitive code, as already documented.
IMHO it'd be nice if OpenStruct doesn't define extra methods, and only uses method_missing + a Hash internally and just inherits from BasicObject, for simplicity and to avoids unexpected performance trade-offs.
There might be some compatibility issues with that, hard to know until it's tried.
Some more thoughts about that in https://github.com/oracle/truffleruby/pull/2702#issuecomment-1209267087
EDIT: I filed https://github.com/ruby/ostruct/issues/51 for this idea.
Updated by byroot (Jean Boussier) over 3 years ago
Actions
#12
[ruby-core:112369]
@Eregon (Benoit Daloze) I'd recommend being extra careful before changing anything in ostruct. There are a bunch of gems out there that abuse it, and last time it was particularly hard to make them compatible.
I'm particularly thinking of https://rubygems.org/gems/recursive-open-struct, which kubeclient uses.
Updated by Eregon (Benoit Daloze) about 3 years ago
Actions
#13
[ruby-core:112784]
The performance gains of using a method_missing-based OpenStruct are huge: https://github.com/ruby/ostruct/issues/51#issuecomment-1461835332
IMO they are clearly necessary, even more so for Rubies with a JIT.
If https://rubygems.org/gems/recursive-open-struct is too hard to make it work IMO it'd be fair for such gems to vendor an old OpenStruct/have their own impl.
But I think it's possible to be 100% compatible, except in the output of .methods which anyway was never guaranteed, so probably it would just work.